
Toronto health officials have released data slides showing how the city is progressing in its fight against the COVID-19 pandemic.
Toronto’s Medical Officer of Health Dr. Eileen de Villa told reporters on Monday that the city has started to successfully flatten the curve and is at its peak period for COVID-19 cases.
De Villa’s first slide released on Tuesday shows that the trajectory of cases of COVID-19 is lower in Toronto than in some countries, including the United States, the United Kingdom and Germany.
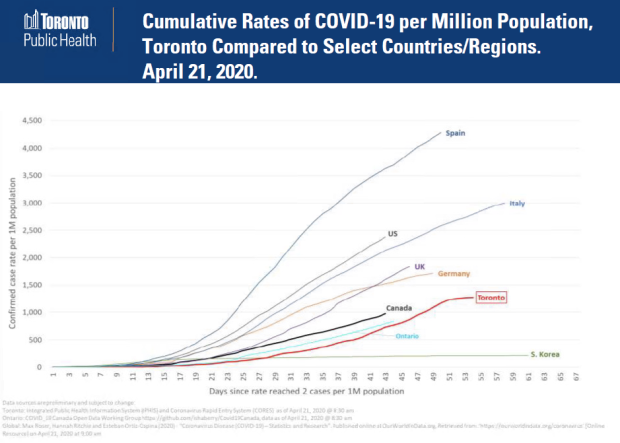
“These countries have unfortunately seen a large number of cases since their COVID-19 outbreaks began,” De Villa told reporters at a news conference Tuesday.
“I believe, at this point, that the number of cases to date in Canada, Ontario and locally in Toronto is lower than originally forecasted due in part to the strong public health measures that were put in place early in our outbreak and the fact that our residents took these measures seriously.”
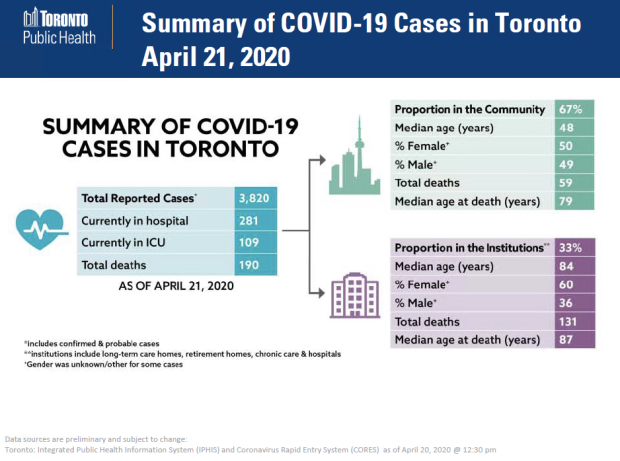
De Villa reported Tuesday that there are now 3,820 cases of COVID-19 in Toronto and 190 people have died.
The second slide shows the number of COVID-19 cases Toronto has had over the span of the outbreak. The graph shows a steady climb in cases and then a plateau.
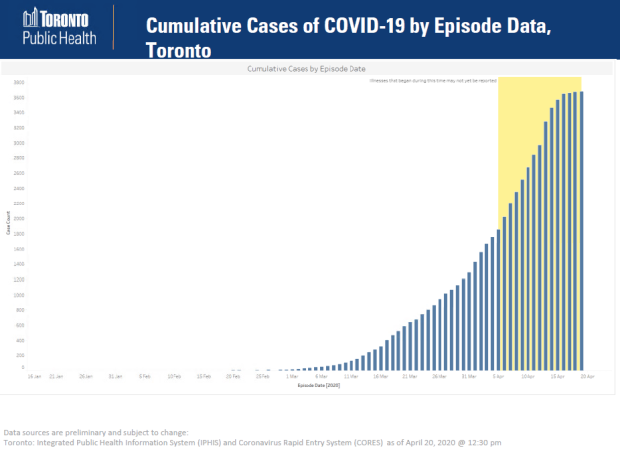 “The second slide … shows that we believe we are now in the peak period of the epidemiological curve of our community outbreak,” De Villa noted.
“I use the term peak period because the peak is not really just one day nor is it just a single number … the reality is that we will only know when we have hit our peak for COVID-19 cases after the peak has passed.”
De Villa said that in order to really confirm the peak has hit, officials need to see the number of new cases levelling and then going down.
“As we move down the curve the timeline of the outbreak may be shorter or longer,” she said.
“This depends in part on our ability as a community to remain diligent in following the public health and physical distancing measures we have put in place.”
The third slide shows the number of hospitalizations, ICU admissions and deaths to date due to COVID-19. The slides show the numbers once again steadily rising and then reaching a plateau.
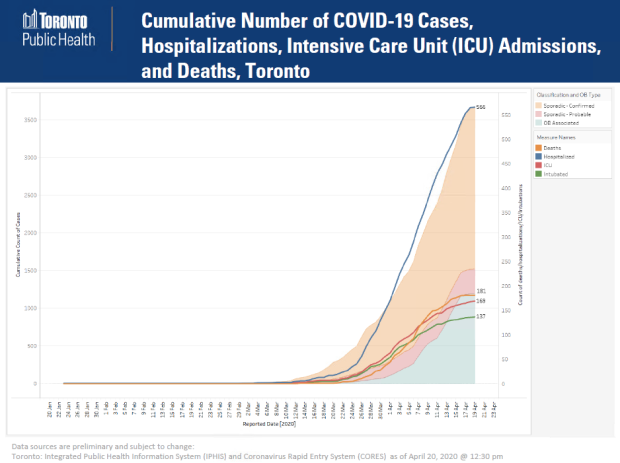
“This information helps us understand how we have used out healthcare system resources during this outbreak,” De Villa said. “The information in slide three should be considered with cautious optimism. It illustrates that we are seeing our curve flattening.”
She said the slide also illustrates the impacts of “our collective work” to prevent the overburdening of the healthcare system and to ensure that health resources remain in place for those “who need them most.”
“This is an important indicator for us to continue to monitor as we move down the curve,” de Villa said.
“It will help us to plan and know when we can begin to ease some of our local public health and physical distancing measures.”
She said the city will likely experience a second wave of COVID-19 because herd immunity to the disease has not been reached yet.
“We will continue to see COVID-19 spreading in our community until we start to experience herd immunity,” she said. “This will not happen until many people are infected with COVID-19 and recover and they build immunity that lasts or we develop a vaccine.”
She said the final slide tells the “tale of the two outbreaks” the city is experiencing, a community one and an institutional one.
She said all four slides represent the main types of data that are being analyzed by the city.


