
Are things looking up for Canadians? According to a new survey, many across the country are feeling happier than they were a year ago.
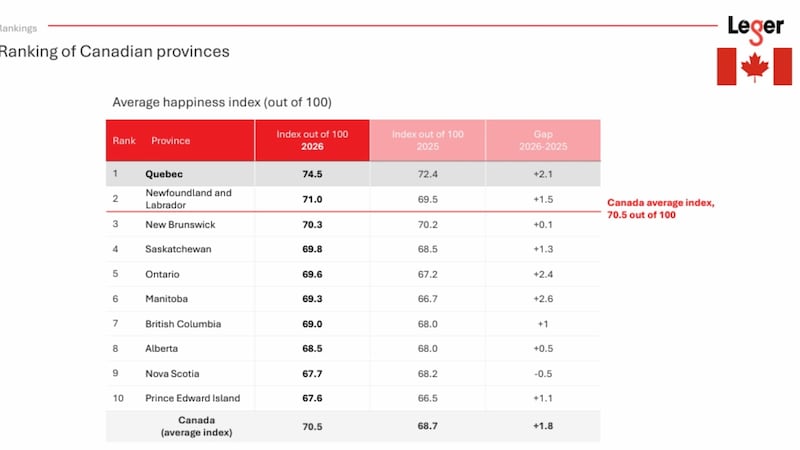
Canadians’ happiness is up slightly from 2025, according to Leger’s Happiness Index 2026, with the national average sitting at 70.5 out of 100, compared to 68.7 in the previous year.
Out of all provinces, Quebec ranked the happiest at 74.5. Newfoundland and Labrador ranked second at 71.0, followed by New Brunswick at 70.3.
Meanwhile, Ontario landed in the middle with a 69.3 index while Prince Edward Island came in last, with a 67.7 index – up slightly from 66.5 a year earlier.
Amongst the country’s largest cities, Montreal came first with an index of 72.7 out of 100, with Brampton in second place, with 71.7 – up five points from 66.7 in 2025 – and Toronto in third, with a 69.4 index, up a few points from 65.8 a year earlier.
Quebec also ranked higher when it came to optimism, with a 72.2 index, compared to 66.6 in the rest of the country. Fewer Quebecers also said they were unhappy – 22 per cent – compared to 33 per cent for the rest of the country.
Andrew Enns, Leger’s executive vice-president for central Canada, told CTVNews.ca that the spike in happiness index from this year to last could have something to do with the time of year the survey was conducted. The 2025 survey was done in March and April, while this year’s was conducted in June.
“One of the factors that might be bumping things a little bit was the fact that March, April, in Canada is a certain time of year where we’re starting in some parts of the country to get out and feel a little more free from winter,” he said. “But for most of us, it’s still not so great. June is definitely a better time, that’s what makes us happy.”

American index almost identical to Canada
The survey also took the temperature on happiness south of the border, with surprising results. Overall, Americans ranked 70.5 out of 100 on the happiness Index, which was the exact same number as Canada.
However, Enns said U.S. states showed a bit more extreme results compared to Canada.
“They had a few states that were higher than most provinces in Canada,” he said. “But then they also have some states that are quite at the lower end.”
The happiest states were Florida with a 75.3 index, followed by Kansas at 74.5, then New Jersey with a 74.4 index.
On the bottom of the list was West Virginia with a happiness index of 62.5.
Enns said that overall, there wasn’t a great deal of differences between the two countries when it came to level of happiness and what’s driving those sentiments.

What contributes to happiness?
Enns said the things that contributed to happiness strongly related to our community, access to outdoor spaces, our neighbours and family.
“Money, affordability doesn’t show up as a big contributor to happiness,” he said. “Financial stress and affordability is definitely a detractor, like it can be added to the unhappy factor, but it doesn’t actually promote the happy factor of when people think about their own personal happiness.”
Happiness in a municipality primarily came down to feeling safe for 46 per cent of Canadians, compared to 51 per cent Americans. That was followed by access to nature – 40 per cent for Canadians and 27 per cent for Americans – and enjoying a good neighbourhood life, which 27 per cent of both Canadians and Americans identified with.
However, when it came to being asked about barriers to happiness, the most common answers related to finances. In Canada, 58 per cent said cost of living affected their happiness, while in the United States, the number was higher at 61 per cent.
Financial pressure – cost of living, housing, debt, income and financial future - was the number one reasons behind the source of pressure for 57 per cent of Canadians and 58 per cent of Americans. That was followed by physical health (57 per cent in Canada, 58 per cent in the U.S.) mental health (23 per cent in Canada and 26 in the U.S.) and uncertainty about the future (23 per cent in Canada versus 21 per cent in the U.S.)
Methodology
The research was based on a online survey filled out by 63,710 Canadians and 6,408 Americans, aged 18 and up. The data was collected between June 9 and 29. Leger said that to ensure the sample accurately represents the population, the results were adjusted based on gender, age, and region.