A newly compiled database with real-time statistics reveals when Toronto’s traffic is at its worst, and how much time and money drivers are losing to congestion.
TomTomTraffic, a European mapmaking and traffic analytics company, released its 2022 traffic index on Feb. 15. Toronto ranked 30th in the list of most congested cities, and the data suggests the time drivers spend sitting in traffic is increasing.
To rank global congestion, the company anonymously monitored how long it took to drive 10 km in 389 cities, collecting trip data spanning 543 billion (10⁹) km worldwide.
In Toronto, the distance of Bloor Street between Castle Frank and Jane subway stations is approximately 10 km. The data found that the average time to drive 10 km in Toronto in 2022 was 22.5 minutes – nearly 2 more minutes than in 2021.
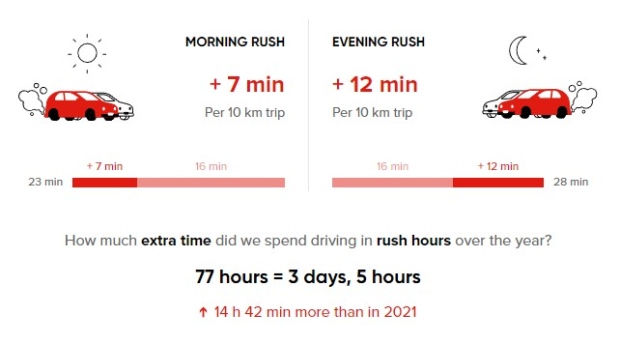
On average, Toronto drivers lost 77 hours in congestion in 2022 – nearly 14 more hours than in 2021. That time costs the city's drivers an extra $155 annually in gas.
Just one day working from home a week can save the city’s drivers 41 hours of sitting in traffic, $151 a year, and prevents nearly 200 kg of carbon dioxide from being emitted – three days working from home save nearly 124 hours, $451, and 591 kg of carbon dioxide.
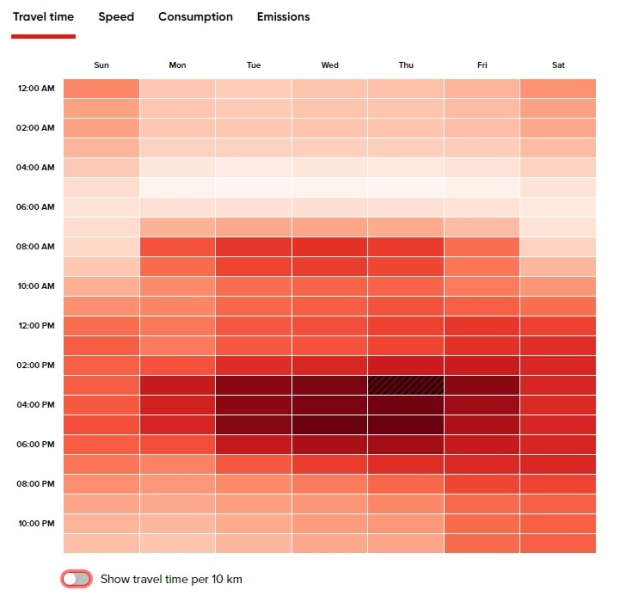
That time fluctuates depending on the time and day of the week.
According to the data, the worst time for traffic in Toronto is Thursdays between 3 p.m. and 4 p.m., during which it takes drivers more than 30 minutes to make it 10 km.
On average, Toronto drivers waste 12 minutes per 10 km in congestion during evening commutes, and seven minutes in the same distance during morning commutes.
A December report by urban mobility app Moovit found that Torontonians have one the longest commutes in North America, spending an average of 56 minutes a day commuting.
Nov. 15 was Toronto’s worst traffic day in 2022, the index states. On that day, a Tuesday, it took drivers an average of 27.5 minutes to move 10 km.
In 2022, Torontonians spent a total of 199 hours driving (77 of those in congestion), spent a total of $755 on gas, and emitted 990 kg of carbon dioxide into the atmosphere.
DRIVING COSTS INCREASING WORLDWIDE
Alongside indexes for 389 cities, TomTomTraffic released data on Feb. 15 showing that the cost of driving is rising in a majority of major metropolitan areas.
“2022 saw an increase in energy prices due to several factors (disrupted supply chains, bad weather, lower investments, etc.) – and the Russian invasion of Ukraine, which greatly exacerbated the situation,” the press release reads.
Globally, drivers have spent 27 per cent more on regular gasoline and 48 per cent more on diesel in 2022 than they did in the year prior, the data shows.
A survey published by The Canadian Automobile Association’s (CAA) South Central Ontario last summer found that of the 1,697 drivers surveyed, 64 per cent said high fuel prices were likely to impact their plans.
To help keep gas costs down, the CAA suggests not starting your vehicle until you need to, avoiding idling, and maintaining a speed of 80 to 90 km/h, the most fuel-efficient range.z
TomTomTraffic also said, in many cities, it found switching to an electric vehicle to be an effective way for people to keep travel costs lower and consistent.
With files from CTV News Toronto’s Phil Tsekouras


